How to measure billboard and DOOH advertising effectiveness
Billboard and digital out-of-home effectiveness should be measured as a chain: confirm that the campaign ran, estimate who had an opportunity or likelihood to see it, determine whether the creative communicated, observe relevant brand and behavioral outcomes, and use a credible comparison to estimate what happened because of the campaign.
Out-of-home advertising is measurable, but it is not measured well by copying a digital click dashboard. A roadside billboard, transit panel, digital citylight and screen inside a store create different exposure conditions. Most have no direct click. They influence people in public, often alongside search, social, retail and other media. The measurement plan must reflect that reality.
The central discipline is to keep delivery, exposure, response and causation separate. Proof that a digital screen played an ad is not proof that a person could see it. An estimated impression is not proof of attention. A store visit after possible exposure is not automatically an incremental visit. Each stage is useful, provided its claim matches the evidence.

OOH measurement becomes more useful when every number answers a named question and every causal claim has a credible comparison.
Why billboard and DOOH measurement are different
Most OOH advertising is one-to-many media. The display sits in a physical environment while audiences move through its potential viewshed. Exposure depends on location, orientation, distance, movement, dwell time, illumination, obstructions and the time an ad is present. A digital screen adds rotation: the screen may be visible while a particular advertiser’s spot is not playing.
The IAB defines digital out-of-home as digital media used for marketing outside the home, combining dynamic screens with data-driven marketing in public and commercial spaces. Its 2025 Digital Out-of-Home Measurement Guide documents the need for shared definitions across data collection, impressions, attribution, incrementality and cross-channel measurement.
Static OOH and DOOH share the same basic evidence chain, but their delivery records differ:
- Static billboard: posting confirmation, unit ID, coordinates, facing, format, installation and removal dates, plus any periods when the panel was obscured or unavailable.
- DOOH: screen ID, creative ID, timestamped proof-of-play or playlog, spot duration, loop length, share of voice and outages, synchronized to the audience data’s time interval.
Measurement also varies by market. National audience currencies use different source data and terminology. Use the accredited or accepted system for the campaign’s country, document its definitions and avoid combining unlike impression types as though they were interchangeable.
The six-layer OOH measurement chain
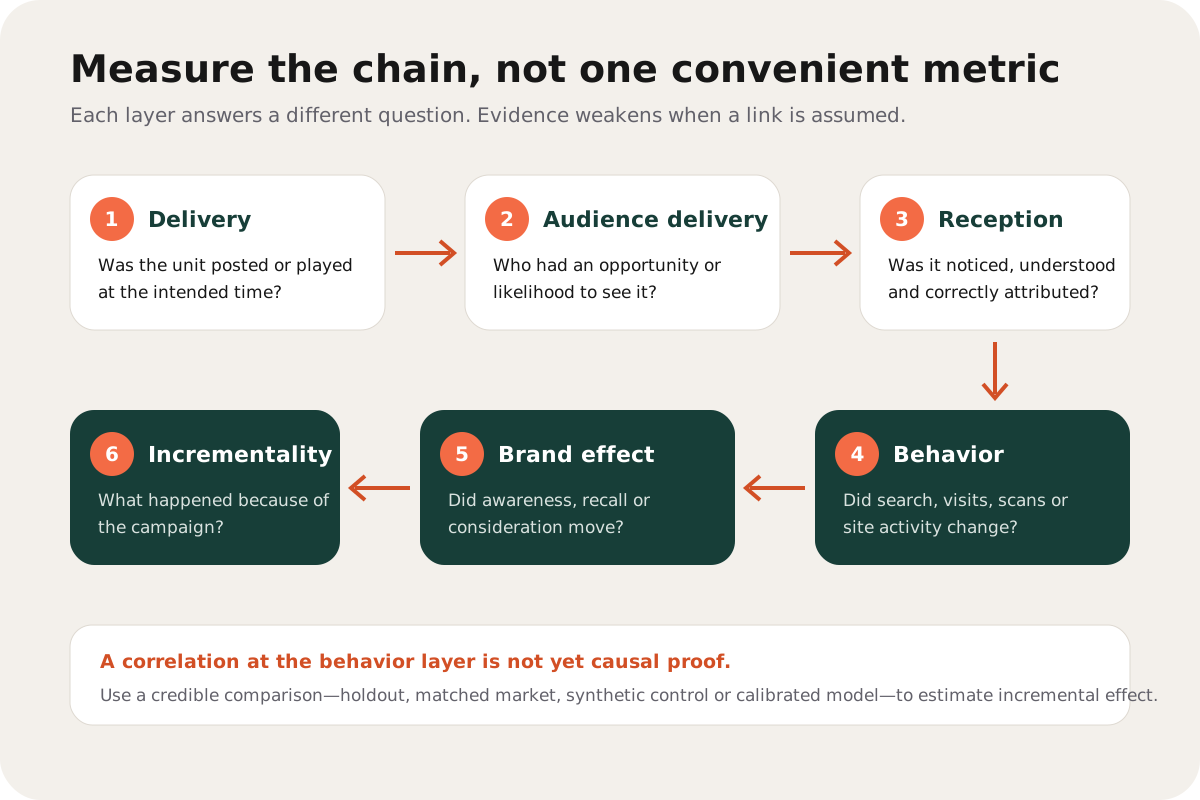
1. Confirm campaign delivery
Begin with what can be verified directly. Were the correct units live on the planned dates? Did the correct digital creative play? Were there outages, substitutions or late postings? Proof of performance should reconcile the buy with actual delivery at unit and creative level.
For DOOH, aggregate screen availability is not enough. Playlogs identify which creative ran, when and for how long. OAAA attribution guidance states that playlogs are required to determine exposure to the specific creative running at the time. Standardized identifiers and synchronized clocks reduce the risk of connecting an audience event to the wrong ad.
2. Estimate audience delivery
Audience measurement moves beyond raw traffic or footfall. It estimates how many people entered a relevant viewing area and, depending on the system, how many were likely to see the display. The result supports impressions, reach, frequency and audience composition.
Opportunity to See (OTS) generally refers to audiences passing through a defined viewshed with an opportunity to view the unit. Likelihood to See (LTS) further qualifies that opportunity using visibility and viewing behavior. Terminology varies, so every report should state which measure it uses.
Geopath’s standards define reach as the percentage of unique people in a market exposed at least once over a period and frequency as the average number of exposures among those reached. Its methodology incorporates inventory location, circulation, visibility, eye-tracking research, demographics and trip modeling rather than treating every passing vehicle as one advertising impression.
3. Measure creative reception
Audience delivery creates an opportunity; the creative must use it. Reception measures include noticed exposure, recall, recognition, comprehension, brand attribution, message takeout and intended emotion. These reveal whether the execution converted physical presence into communication.
Use realistic exposure. A roadside asset should be evaluated at the intended distance and dwell time. A transit-shelter poster can allow closer inspection. A retail screen competes with shopping tasks and neighboring displays. Full-screen, unlimited desktop viewing hides many OOH failures.
Attention is useful here, but it remains an intermediate signal. The IAB/MRC attention guidance warns that attention should not be treated as an outcome by itself. Connect attention to the advertiser, message and campaign objective.
4. Observe relevant behavior
OOH may influence branded search, direct site traffic, store visits, calls, app activity, route choice, coupon use or purchases. Select behavior from the campaign objective rather than reporting every signal available.
QR codes, short URLs and promo codes can provide deterministic response counts, but they capture only people who use that route. A person may see a billboard, search the brand later and buy in a store. Low scan volume does not prove that the placement had no effect; high scans do not reveal the total effect.
Location-based visit studies can be valuable when the exposure and destination geofences are precise, sample coverage is adequate and consent and privacy controls are appropriate. Device presence near a unit remains an exposure proxy. It should not be described as confirmed human attention.
5. Measure brand effects
When the job is awareness, memory or consideration, brand lift is closer to the objective than clicks. Common measures include unaided and aided awareness, ad recall, correct attribution, message association, familiarity, favorability, consideration and intent.
Survey exposed and comparable unexposed groups using consistent recruitment, timing and question wording. Report sample size and uncertainty. Control for pre-existing brand differences because people who travel through certain locations may differ from those who do not.
Ask unprompted questions before recognition prompts. “Which advertising have you noticed recently?” provides different evidence from showing a campaign image and asking whether it looks familiar.
6. Estimate incremental business impact
Incrementality asks what happened because the campaign ran, above what would otherwise have occurred. This requires a counterfactual: a credible estimate of the outcome without the OOH campaign.
The IAB DOOH guide identifies synthetic controls and matched market or store tests as two principal incrementality approaches. A synthetic control models a comparison group resembling the exposed population. A matched-market test runs the campaign in selected markets while comparable markets remain unexposed. Matched-store designs apply the same logic to retail locations and transaction data.
Marketing mix modeling can estimate OOH contribution across longer periods and multiple channels when inputs are sufficiently granular. It needs actual campaign timing, geography, spend and delivery rather than a flat monthly budget line. Results depend on model specification, data quality and the ability to separate OOH from promotions, distribution, seasonality and other media.
Core billboard and DOOH metrics
Impressions
An OOH impression is an audience estimate, not a server event. Confirm whether the number represents circulation, OTS, LTS or another qualified audience measure. For rotating digital inventory, the calculation should account for the probability that the advertiser’s spot was present while the audience could view the screen.
Reach
Reach is the number or percentage of unique people in the defined audience exposed at least once during the stated period. Specify the geography, target population, period and deduplication method. “Reach” without those boundaries is incomplete.
Frequency
Frequency is the average number of exposures among people reached. Average frequency can hide a skewed distribution in which some commuters receive many exposures and others only one. Ask for the frequency distribution when repetition matters.
GRPs and TRPs
Gross Rating Points express in-market impressions as a percentage of the market population. Target Rating Points apply the same logic to a defined target. A common planning relationship is:
Rating points = reach percentage × average frequency.
These measures describe audience delivery. They do not establish message comprehension or sales impact.
Cost efficiency
Cost per thousand impressions can compare delivery costs when the impressions use compatible definitions. Cost per reached person, incremental visit, incremental sale or point of brand lift may be more decision-relevant later in the chain. Do not compare a modeled LTS impression with an unqualified footfall count as if they were the same currency.
Lift
Relative lift compares the outcome rate in a test group with a credible control:
Relative lift = (test rate − control rate) ÷ control rate.
Also report the absolute percentage-point difference. A move from 1% to 1.2% is a 20% relative lift and a 0.2-point absolute increase. Both are needed to judge commercial importance.
Choose a method that can answer the question
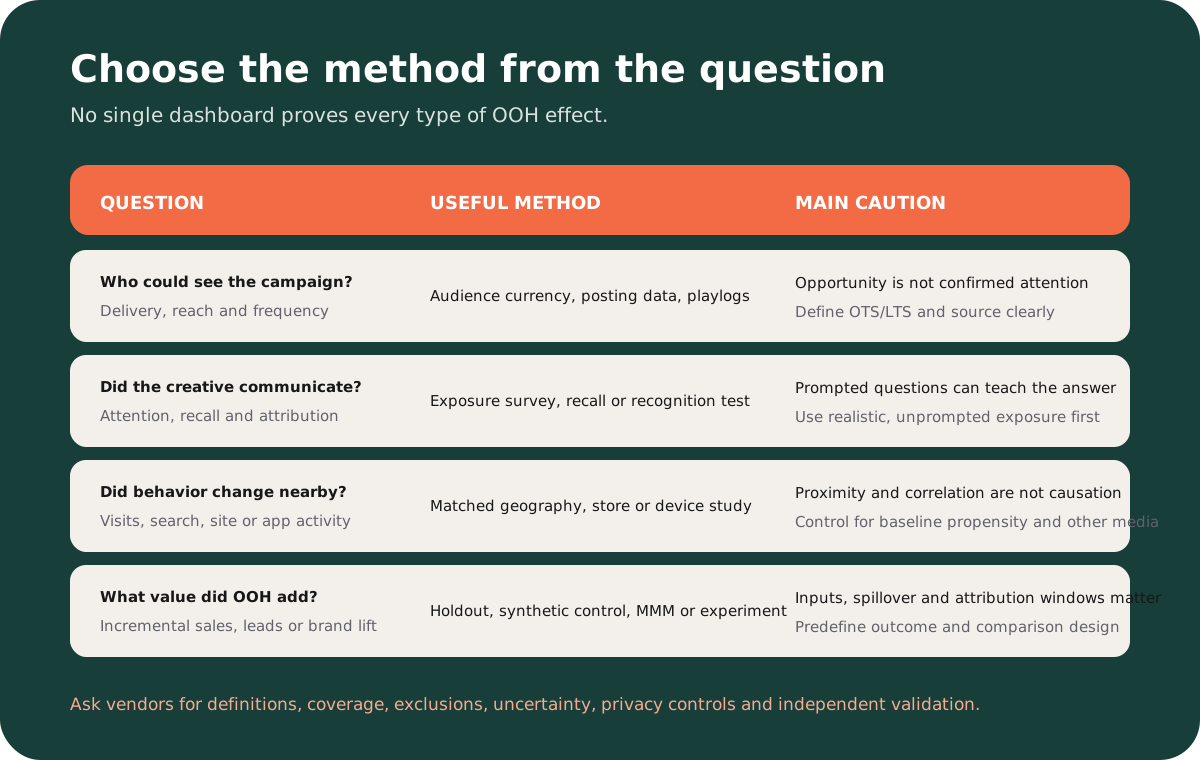
Audience currency and delivery reporting
Use recognized audience measurement for planning and delivered reach and frequency. Combine it with posting records or DOOH playlogs. This answers who could or was likely to see the campaign; it does not answer whether the creative changed an outcome.
Creative diagnostics and exposure tests
Use structured analysis before launch to inspect viewing distance, hierarchy, readability, cognitive load, branding, message and context fit. Add short-exposure audience testing when misinterpretation or attribution risk is high. These methods explain communication quality while changes are still inexpensive.
Brand-lift surveys
Use surveys when the objective concerns awareness, recall, meaning or consideration. Exposure groups may be defined geographically, through modeled device exposure or by controlled recruitment. The validity depends on comparable groups, representative samples and neutral questioning.
Search, site and call analysis
Branded search, direct traffic and calls can reveal timing or geographic patterns. Use campaign start dates, market comparisons and time-series baselines. These signals are accessible but easily affected by other media, news, promotions and seasonality.
Footfall and location studies
Use precise unit viewsheds, destination boundaries and minimum dwell rules. Exclude employees, pass-through traffic and implausible journeys. Document device coverage, deduplication, population weighting and consent. Compare exposed and unexposed groups on pre-campaign visitation propensity wherever possible.
Matched markets, matched stores and geo experiments
Select test and control areas using the variables most predictive of the outcome: historic sales, category demand, price, distribution, demographics, competitive activity and other media. Measure a pre-period, run the campaign only in test areas when feasible and compare the change rather than only post-campaign levels.
Synthetic controls
When a clean holdout is unavailable, construct a weighted combination of unexposed markets or people that matches the test unit before launch. Examine pre-period fit, contamination and sensitivity to alternative specifications. A synthetic control is a modeled counterfactual, so transparency matters.
Marketing mix modeling
MMM is useful for longer-term, cross-channel budget questions. Provide OOH at the most meaningful time and geographic granularity, with format and creative distinctions where scale permits. Include carryover and saturation assumptions. MMM is less suited to explaining the performance of a single small placement.
Build the measurement plan before the campaign runs
1. Translate the objective into a primary outcome
“Drive growth” is not a measurement specification. Name the outcome, population, geography and period. Examples include unaided awareness among category buyers, first visits to participating stores, qualified site sessions or incremental sales of a named product.
2. Write the causal question
State what comparison would change the decision: “Did four weeks of DOOH increase first-time store visits in the test cities relative to comparable cities without the campaign?” This sentence clarifies the intervention, result and counterfactual.
3. Preserve unit and creative identifiers
Create a location list with unit IDs, coordinates, facing, format and dates. Assign a stable ID to every creative version. For DOOH, retain complete playlogs. Without these records, creative-level or time-specific analysis becomes guesswork.
4. Record baselines and confounders
Collect pre-campaign outcomes and document price changes, promotions, distribution, competitor activity, events, weather and other media. If the campaign runs during a holiday, comparing the flight with the immediately preceding quiet period will exaggerate lift.
5. Choose the comparison design and sample
Define test and control selection, exposure rules, exclusions, sample-size logic and minimum detectable effect. Agree on the primary result before seeing the data. Small samples can make commercially meaningful effects impossible to distinguish from noise.
6. Set attribution timing
The appropriate window follows the behavior. A quick-service visit may occur soon after exposure; a vehicle purchase takes longer. Test reasonable alternatives, but do not select the window that produces the largest lift after the fact.
7. Define privacy and governance
Use aggregated and privacy-conscious measurement where possible. Document consent, data sources, retention, access and any identity matching. Location data can be sensitive. Legal and privacy review should be part of study design rather than a final checkbox.
8. Predefine the decision rule
Specify what result leads to scaling, revision, another test or no change. Include commercial materiality and uncertainty, not only statistical significance. A precise but tiny lift may not cover media and production cost.
Measure whether the OOH creative did its job
A media plan can deliver its audience while the execution fails. Evaluate the actual supplied asset in its intended environment. Key questions include:
- At the expected distance and speed, what can be recognized?
- Does the first visual cluster contain the brand and central promise?
- Can the headline be read during the likely viewing time?
- Is secondary copy truly necessary, and does it survive?
- Does the image explain, compete with or contradict the message?
- For DOOH, does the idea work at the beginning of the spot and without sound?
- Does the action make sense for someone moving through that location?
Optiks.ai evaluates these relationships through viewing distance, attention, hierarchy, readability, cognitive load, message, brand, emotion, color, composition, persuasion and context fit. A structured creative analysis should generate testable hypotheses, such as “increasing headline-background contrast will improve unaided message retrieval at eight meters,” rather than claiming to predict sales on its own.
For the broader system, read what makes an advertisement effective. The guides to readability, attention and context fit cover the most common OOH constraints in depth.
Worked example: measuring a fictional city-center DOOH campaign
A fictional homeware brand, Fold, introduces a sculptural table lamp through digital citylights in two metropolitan areas. The campaign job is to establish the product’s distinctive folded form and increase qualified visits to selected stores.
Delivery and audience
The agency supplies screen IDs, coordinates, planned dates, six-second spot duration, loop length and creative ID. The media owner provides timestamped playlogs and outage records. The audience provider estimates LTS impressions, target reach and frequency for adults living within the store trade areas.
Creative reception
Before launch, the asset is tested at street-view scale for four seconds. Most participants recognize a lamp and retrieve the folded shape, but the brand is weakly attributed. The team enlarges a distinctive coral brand device and places it beside the product rather than at the final frame. A focused retest improves unaided attribution without adding copy.
Brand and behavior outcomes
The primary brand outcome is correct brand-product association. The behavioral outcome is first-time visits to participating stores. Branded search and product-page traffic are secondary diagnostics, reported by city and day.
Comparison design
The two test markets are paired with control markets using historic store visits, sales, population, category demand and other media. Eight weeks of pre-period data establish parallel movement. Stores running unrelated promotions are excluded before analysis.
Interpretation
Visits rise in both test and control markets because of seasonal demand, but the increase is larger in the test markets. The difference-in-differences estimate is reported with uncertainty and sensitivity checks. Correct association also improves in the exposed survey group. The team concludes that the campaign likely created incremental visits, while noting possible spillover from commuters and imperfect exposure classification.
The report does not claim that every visit near a screen was caused by the ad. It connects verified delivery, modeled audience, creative evidence and a credible market comparison into one bounded conclusion.
Common OOH measurement mistakes
Counting traffic as impressions
Vehicles or pedestrians passing a location do not equal people with a valid viewing opportunity. Use a recognized audience method with transparent visibility assumptions.
Calling proof of play an impression
A playlog proves that a file played. It does not prove that an audience was present or that the screen was visible. Join delivery and audience data at compatible time intervals.
Treating possible exposure as attention
A mobile device in a viewshed is an exposure proxy. It does not verify where the person looked. Keep OTS, LTS and observed attention distinct.
Using QR scans as total response
Scans measure one response path and often underrepresent broader search, visit and memory effects. Use them as a diagnostic unless the campaign explicitly makes scanning its primary action.
Comparing exposed and unexposed people without a baseline
People who pass a downtown screen may already shop, travel and search differently. Match or adjust for pre-existing outcome propensity and geography.
Ignoring other media and promotions
A campaign rarely runs in isolation. Record overlapping channels, price, distribution and events. Otherwise the model may credit OOH for demand created elsewhere.
Choosing the attribution window after seeing results
Longer windows capture more conversions and more unrelated events. Set a behavior-based primary window in advance and label sensitivity analyses.
Reporting lift without the base rate
A large relative percentage can describe a small absolute change. Report test and control rates, absolute difference, relative lift, sample size and uncertainty.
Pooling creative versions
If executions differ, preserve IDs and delivery. Aggregation can hide a strong unit behind a weak one and prevent the next campaign from learning.
Frequently asked questions
How do you measure billboard advertising effectiveness?
Confirm posting, use recognized audience data for reach and frequency, test whether the creative is noticed and attributed, measure the outcome tied to the objective, then estimate incremental effect with a credible comparison. No single metric completes the job.
What is the difference between OOH and DOOH measurement?
Both require delivery, audience, reception and outcome evidence. DOOH additionally needs time-specific proof-of-play, creative and screen IDs, spot duration, loop information and outage data because multiple ads can rotate on one screen.
Can foot traffic prove that a campaign worked?
It can support the case, but proximity alone does not prove causation. Strong studies compare exposed and unexposed groups or markets, use pre-period behavior, control for other differences and disclose how exposure and visits were classified.
How are billboard reach and frequency calculated?
Audience systems combine inventory, circulation or mobility, visibility and population data. Reach estimates unique people exposed during a period. Frequency is the average exposure count among those reached. The exact methodology varies by market.
How can a small advertiser measure one billboard?
Use a proportionate plan: verified posting, a pre/post geographic trend in a relevant outcome, a memorable short URL or code, customer-source questions and a realistic creative check. Conclusions will be directional because one unit rarely supports a strong causal design.
What should a DOOH measurement report include?
Include units, dates, creative IDs, playlogs, audience source and definitions, reach, frequency, outcome specification, comparison design, exclusions, attribution window, sample size, uncertainty, privacy controls and limitations.
Measurement begins with a creative that has a realistic chance to communicate. Use the billboard design best-practices guide to review viewing distance, readability, hierarchy and message length before the campaign launches.
Research and references
- IAB: Digital Out-of-Home Measurement Guide
- IAB: Digital Out-of-Home Measurement Guide, full report
- IAB: Digital Out-of-Home definition and core features
- World Out of Home Organization: Global OOH Audience Measurement Guidelines 2026
- Geopath: Reach and Frequency—A Primer
- OAAA: OOH glossary of terms
- OAAA: Best Practice for OOH Attribution Modeling
- IAB: Attention Measurement framework
The Fold example is fictional. Audience measurement, location data, causal modeling, regulated claims and privacy compliance should involve appropriately qualified specialists and the applicable market standards.
Measure OOH from verified delivery to incremental outcome. When each link is explicit, the campaign can prove more than presence: it can show how placement and creative combined to create value.