The science of attention in advertising: how the brain selects what gets noticed
Attention is not a passive response to whatever happens to be brightest or biggest. It is a selective process through which the brain gives some signals priority over others. That competition is influenced by contrast, position and movement, but also by goals, learned associations, memory and the meaning of the scene. For marketers, the important question is not simply whether an ad attracts a look. It is whether the right information wins enough processing to support recognition, understanding and action.
A team reviews a drinks poster on a large screen. The can is covered in condensation. An orange slice signals flavor. The headline dominates the upper third, and the logo is crisp at the base. Given time, every element is available.
The poster has a different life at a bus shelter. One passerby is looking for the route number. Another is searching for somewhere to buy a drink. A third is absorbed in a conversation. The visual stimulus is the same, but the attentional state is not.
This is the central problem in advertising attention. Creative execution can make information more or less competitive, but it does not control the viewer like a cursor. The brain selects from a crowded field according to both sensory evidence and current behavioral priorities.

Attention is a selection problem
The visual system receives far more information than can be processed with equal depth at the same time. Attention helps resolve that imbalance. It increases the priority of information that is relevant to current behavior and suppresses or postpones other information.
Robert Desimone and John Duncan’s influential account describes attention as competition between neural representations. In their words, attention is an emergent property of many neural mechanisms working to resolve competition for visual processing
. Desimone and Duncan, 1995.
The phrase biased competition is useful for creative strategy. Objects, words, faces, prices and logos compete for processing. The competition can be biased by properties of the stimulus, such as contrast or orientation, and by information held in mind, such as the color of a product someone is trying to find.
Animal neurophysiology provides part of the mechanism. In experiments involving macaque visual cortex, Reynolds, Chelazzi and Desimone found that the response to multiple stimuli reflected competition between their neural representations. Directing attention to one stimulus shifted the neuronal response toward the response produced by that stimulus alone. Reynolds, Chelazzi and Desimone, 1999.
That experiment is not an advertising effectiveness study, and a neural response in macaques cannot tell us which poster will sell more drinks. Its relevance is conceptual: several visible items do not receive identical processing simply because they occupy the same frame. Selection changes their effective influence.
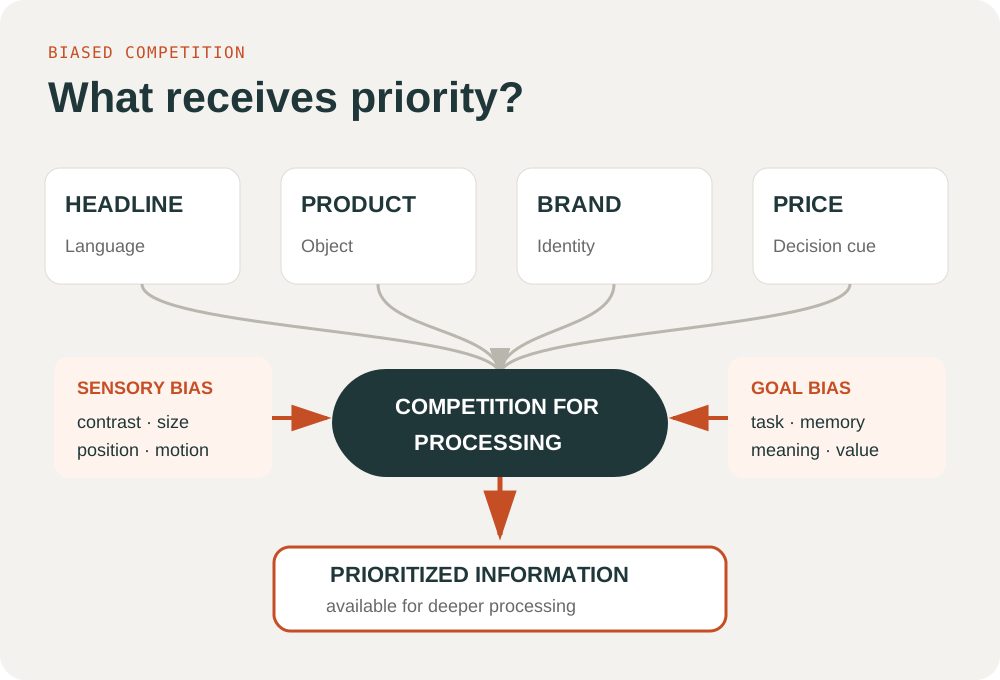
Two sources of priority: the stimulus and the viewer
Marketers often talk about attention as if it sits inside the artwork: a red button has attention, a face has attention, a large headline has attention. A more accurate view is relational. A visual feature may be conspicuous in one scene and ordinary in another. It may also be relevant to one person’s task and irrelevant to somebody else’s.
Stimulus-driven priority
Local differences in color, luminance, orientation, size or motion can make a location conspicuous. This is usually called bottom-up or stimulus-driven guidance. It operates quickly because it can be computed from the incoming visual pattern before the viewer has interpreted the full meaning of the scene.
Laurent Itti, Christof Koch and Ernst Niebur developed a biologically inspired computational model in which multiscale image features are combined into a saliency map and conspicuous locations are selected for further analysis. Their model is important because it formalized one part of early visual selection. Itti, Koch and Niebur, 1998.
A saliency model can therefore help answer a narrow question: which regions are visually distinctive according to the features represented in that model? It cannot, by itself, establish that a viewer recognized the brand, understood the offer, felt an emotion or changed behavior.
Goal-directed priority
The brain also uses expectations and current goals to prepare for relevant input. Someone looking for a bottle of water can prioritize features associated with bottles and the part of a store where drinks are normally found. Someone comparing electric vehicles may search an ad for range, price or charging information.
Corbetta and Shulman’s review of neuroimaging research distinguished systems involved in goal-directed attentional control from systems involved in detecting behaviorally relevant events. They described a dorsal frontoparietal network associated with applying top-down selection and a more ventral, predominantly right-hemisphere network that can interrupt ongoing selection when a relevant stimulus appears. Corbetta and Shulman, 2002.
This is more nuanced than a battle between rational and emotional brains. Both stimulus-driven and goal-directed influences are part of normal perception, and they interact. A vivid orange pack may attract priority because it differs from its surroundings; a familiar pack may be found because the viewer already knows what to look for.
Five influences on visual search
Jeremy Wolfe and Todd Horowitz summarize visual-search guidance through five broad influences: bottom-up salience, top-down feature guidance, scene structure and meaning, previous search history, and the relative value of targets and distractors. They begin from the constraint that fundamental limits on visual processing make it impossible to recognize everything at once
. Wolfe and Horowitz, 2017.

Each influence has a practical advertising equivalent:
- Bottom-up salience: a saturated product pack against a muted background, or a moving element in an otherwise static display.
- Top-down guidance: a shopper looking for the vegan marker, a driver searching for a fuel price, or a diner looking for the cost of a meal.
- Scene structure: the expectation that a brand sits near a product, a price near an offer, or directional information near an entrance.
- Selection history: repeated exposure can bias attention toward locations or features that have previously been useful, even before a person consciously explains that pattern.
- Value: signals associated with reward, urgency or personal relevance can gain priority because of what they have come to mean.
These mechanisms explain why an ad cannot be evaluated solely as a flat collection of pixels. The same creative enters different competitive environments and meets people with different expectations.
Attention is not one thing
In everyday marketing language, “attention” can refer to at least four different events:
- Orienting: attention shifts toward a location or object.
- Selection: one representation gains priority over competing information.
- Maintenance: processing remains focused long enough to extract useful information.
- Transfer: attention moves from one element to another, such as from the product to the brand or offer.
An execution can succeed at one and fail at another. A face might trigger an orienting response but keep attention away from the product. A pack might be selected quickly but not held long enough for the variant to be understood. A strong image might earn a first look without transferring attention to the advertiser.
This distinction is important when choosing evidence. Time to first fixation concerns orienting. Fixation probability concerns selection under the test conditions. Dwell time may concern maintenance, but can also reflect difficulty or confusion. A scanpath can describe observed transitions, although it does not by itself explain why they occurred.
What advertising research says about image, text and brand
Rik Pieters and Michel Wedel analyzed infrared eye-tracking data from 1,363 print advertisements shown to more than 3,600 consumers. Rather than asking whether larger ads receive more attention, they examined how the size of three elements—brand, pictorial and text—related to attention capture and transfer within ads. Pieters and Wedel, 2004.
Their findings do not support a single “make it bigger” rule:
- The pictorial element was particularly effective at capturing attention, and this advantage was independent of its size in their analysis.
- Text attracted more attention as its surface area increased.
- The brand element was especially effective in transferring attention to other parts of the ad.
- Only increases in text area produced a net gain in attention to the advertisement as a whole in that study.
The paper’s own formulation is precise: The three key ad elements ... each have unique superiority effects on attention
. That is a better strategic reading than assuming imagery, copy and branding perform the same attentional job.
The findings concern the print ads and testing conditions in the study. They do not tell a team how large a logo should be on an outdoor poster, a social video or a digital menu. They do suggest that changes should be connected to a hypothesis about the function of the element being changed.
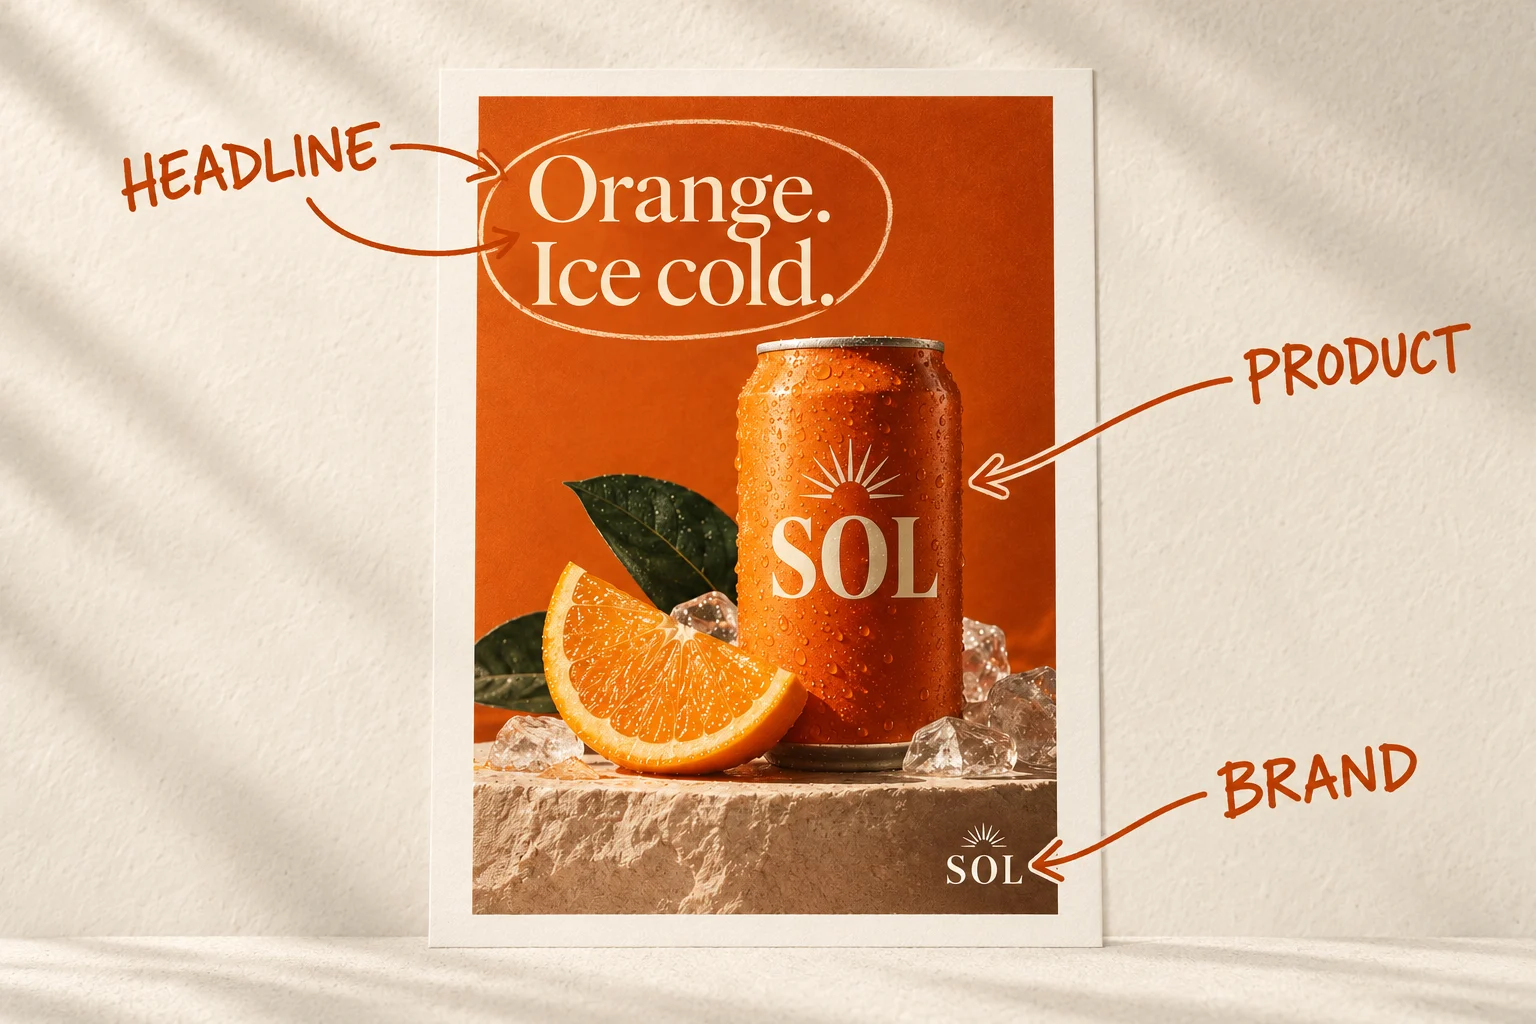
A worked example: diagnosing the SOL poster
Consider the fictional SOL poster above. The commercial objective is to introduce a chilled orange drink. The communication objective is narrower: after a brief encounter, a passerby should be able to identify the product category and connect it with SOL.
A top-line review might say that the poster is bright and eye-catching. A behaviorally informed review asks more specific questions.
1. What is competing?
Inside the poster, the headline, can, orange slice and two instances of SOL all compete for processing. Outside it, people, vehicles, reflections and transport information add more signals. The relevant unit is therefore not just the poster; it is the poster in a viewing situation.
2. What can bias the competition?
The orange field creates a strong chromatic region against a neutral street. The bright type contrasts with the background. The can’s vertical form and condensation differentiate it from the flat field. These are stimulus properties that may increase priority.
The viewer’s goal creates another bias. Someone seeking a drink may prioritize the product faster than someone checking a timetable. A person familiar with SOL may use the wordmark or pack shape as a search template. Someone who has never encountered the brand cannot rely on that memory.
3. What must attention transfer to?
If the orange slice earns the first look, the commercial value depends on what follows. Can the viewer move from sensory cue to product, and from product to brand? A striking fruit image that remains disconnected from the advertiser may generate visual interest without useful attribution.
4. What outcome should be tested?
If the concern is attribution, the relevant outcome is not simply how long people looked at the brand area. Ask whether they can identify SOL after an exposure representative of the placement. If the concern is product comprehension, ask what they believe is being advertised. If the concern is selection from a shelf, measure whether they can find the product among realistic alternatives.
Each measure answers a different question. Combining them can help explain the route from visual selection to communication, but no single metric stands for the entire process.
When the ad competes with itself
Suppose the brief grows. The poster gains a “new” badge, a second headline, a promotional ribbon and decorative shapes. Each addition has a stakeholder and a rationale. Together, they change the competitive field.
Research on visual clutter helps make this more than a matter of taste. Ruth Rosenholtz, Yuanzhen Li and Lisa Nakano compared computational measures of clutter with visual-search performance. Their feature-congestion account examined local variability in color, contrast and orientation—properties that can make target separation harder when many similar signals occupy the same region. Rosenholtz, Li and Nakano, 2007.
Consumer research offers a related finding. Chris Janiszewski distinguished deliberate, goal-directed search from exploratory search in which viewers have less stored knowledge about how to proceed. Across display studies, the visual competition surrounding focal information influenced attention and memory for that information. Janiszewski, 1998.
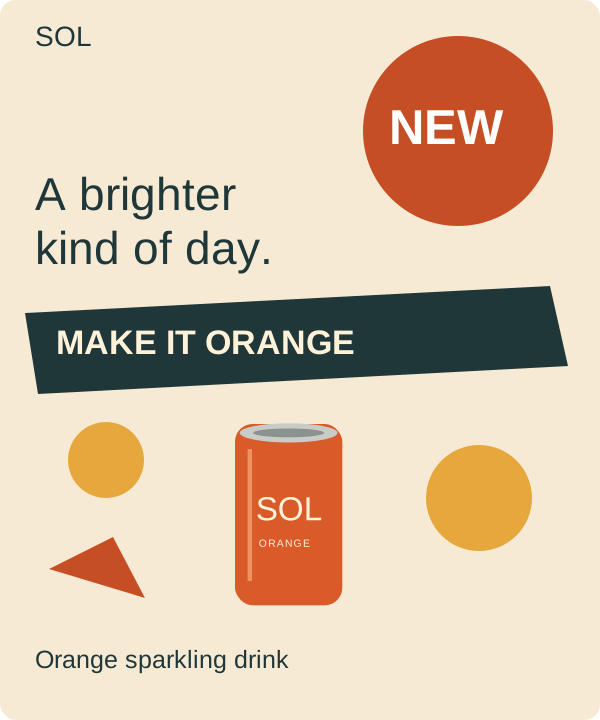
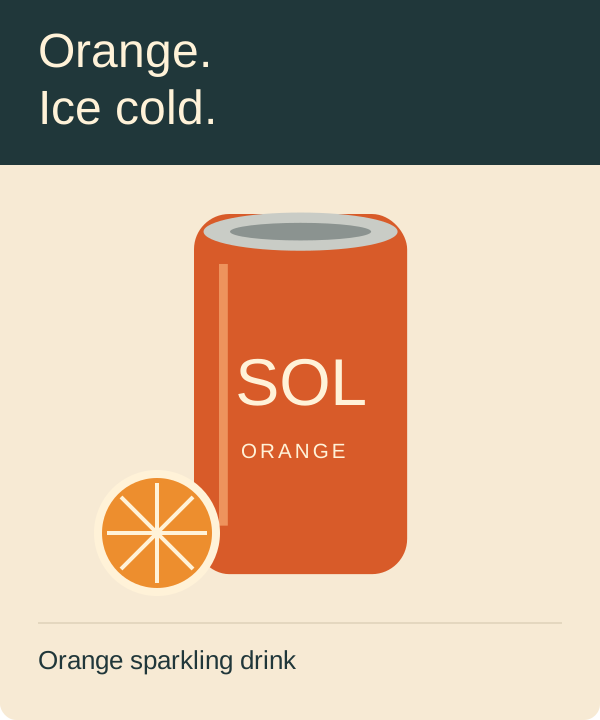
Illustrative design comparison. Neither version has been tested; no attention improvement is claimed.
The cleaner alternative is not automatically better. It represents a hypothesis: reducing nearby competition and strengthening the branded product may improve product identification and attribution. That proposition can be tested. It should not be disguised as a neurological certainty.
Context changes what wins
Attention operates within a scene, and scene knowledge constrains search. People do not inspect every location with equal probability. They use learned regularities: road signs appear in certain places, prices sit near products, and navigation controls occupy expected areas of an interface.
This creates a practical tension. Novelty can attract attention by breaking a pattern, while convention can speed search by meeting an expectation. A call to action placed somewhere unexpected may be visually distinctive but harder to find when a viewer is actively looking for it.
Four examples show how the balance changes:
- Outdoor: visual contrast has to work at distance and in peripheral competition. The first job may be category and brand identification rather than full proposition comprehension.
- Retail shelf: the viewer may search using a known pack color, shape or brand mark. Distinctive assets can function as retrieval cues, while near-identical variants can slow discrimination.
- Menu board: the customer often has an explicit task. Product names, prices and choices should support goal-directed search rather than merely attract a general look.
- Social feed: motion and faces can orient attention, but their value depends on whether they connect quickly to the product and message before the viewer continues scrolling.
The foodservice path-to-purchase guide shows how one campaign can require different information as a customer moves from noticing to choosing.
Attention is necessary, but it is not memory or persuasion
Attention changes the probability that information will receive processing. It does not guarantee what happens next.
A person can fixate on a price and misunderstand what it includes. They can notice a striking image and forget the advertiser. They can read a claim clearly and reject it. They can also process some information in peripheral vision without a fixation directly on the element.
For marketers, this means keeping adjacent constructs separate:
| Question | Construct | Possible evidence |
|---|---|---|
| Was the element selected visually? | Attention | Eye tracking, search time, detection accuracy |
| Was the proposition interpreted correctly? | Comprehension | Open-ended explanation, task accuracy |
| Was the brand retained? | Memory | Recognition or unaided recall after an appropriate delay |
| Did evaluation or choice change? | Persuasion or behavior | Attitude, preference, choice or in-market outcome |
An attention result becomes commercially meaningful when it is connected to the communication objective and then to an appropriate downstream measure. “More attention” is too vague to serve as a universal optimization target.
What neuromarketing can—and cannot—add
Neuromarketing can refer to neuroscience methods such as EEG or fMRI, physiological measures, eye tracking, or commercial prediction systems. Grouping them under one label can conceal substantial differences in what they record.
Eye tracking estimates gaze position. EEG records electrical activity at the scalp with high temporal resolution but limited spatial precision. fMRI measures blood-oxygen-level-dependent signals and offers a different trade-off between spatial and temporal resolution. Computational saliency models analyze properties of an image. None is a direct readout of desire or purchase intent.
The scientifically responsible language is method-specific. “Participants looked at the product earlier” is an observation tied to a study. “The model predicts higher visual salience in this region” is a computational estimate. “This pattern is associated with attentional control under these conditions” is a neuroscientific interpretation. “The brain loves this ad” is not a meaningful finding.
Our eye-tracking guide explains how exposure, task, areas of interest and data quality affect the interpretation of gaze results.
A research-informed attention review
A useful review translates the theory into a set of explicit hypotheses.
- Define the behavioral moment. Record the placement, viewing distance, exposure opportunity, competing material and likely task. “Outdoor” is too broad; a bus shelter and a highway billboard create different attentional problems.
- Name the target information. Specify what the audience must identify: category, product, benefit, price, brand or action. Do not give six elements equal priority and call the result a hierarchy.
- Identify the sources of competition. Include both internal competition inside the asset and external competition in the environment.
- Separate salience from relevance. Ask what is visually conspicuous and what the viewer is likely to search for. The best solution often aligns them.
- Map the required transfer. If an image attracts attention first, decide where processing needs to move next. Product-to-brand and offer-to-action are different transfer problems.
- Make one interpretable change. Change a specific relationship—such as product-background separation or brand proximity—rather than increasing every element.
- Choose a measure that matches the hypothesis. Gaze, comprehension, recognition and choice answer different questions. Use more than one when the decision warrants it.
Optiks.ai treats attention as one domain within the Creative Fingerprint because it interacts with message, readability, hierarchy, brand and context. A recommendation should explain the suspected mechanism and intended outcome, while leaving room for audience testing.
Common questions about advertising attention
Is there a universal three-second rule?
No single exposure duration describes every placement or task. Three seconds can be a useful design constraint for a passing encounter, but it is not a universal limit imposed by the brain. Specify the real viewing opportunity and test against it.
Do faces always attract attention?
Faces can be behaviorally important stimuli, but “always” is too strong. Their influence depends on the scene, task, expression, placement and competing information. The commercial question is whether any attention to the face supports the message and attribution.
Should the logo be the largest element?
No fixed ranking works across briefs. Brand attribution can come from a wordmark, distinctive pack, color system or other learned assets. The correct question is whether the intended audience can connect the communication to the brand under realistic conditions.
Does longer dwell time mean stronger engagement?
Not necessarily. Longer viewing can reflect interest, effort, ambiguity or difficulty. Interpret dwell time with the task, scanpath, comprehension and other relevant measures.
Can an AI attention map replace eye tracking?
No. A model predicts from its training and assumptions; eye tracking records estimated gaze from participants in a defined task. They can support different stages of a review, but they are not interchangeable and neither directly measures persuasion.
The strategic value of attention science
The science does not provide a formula for forcing people to look. It provides a better model of the problem.
Visual elements compete. The brain biases that competition using sensory properties, goals, memory, scene structure and learned value. A design can influence some of those inputs, but its success depends on the context and on what the viewer is trying to do.
For marketers, that shifts the review from “Is it eye-catching?” to a more useful set of questions: What is likely to win selection? Why? What must attention transfer to? Which outcome would show that the communication worked?
Read the science of visual hierarchy in advertising to see how prominence, grouping and viewer goals shape the order in which information is found.
Use the pre-launch creative review guide to place those questions within a wider assessment of effectiveness.
For a practical OOH application, see billboard design best practices for distance, readability and message length.
Research referenced
These papers support the explanations of attention, search and competition. The SOL campaign and proposed revisions are editorial applications. They are not experiments reported in the papers and do not constitute validated predictions of campaign performance.
- Desimone, R., & Duncan, J. (1995). Neural mechanisms of selective visual attention. Annual Review of Neuroscience, 18, 193–222. DOI: 10.1146/annurev.ne.18.030195.001205.
- Reynolds, J. H., Chelazzi, L., & Desimone, R. (1999). Competitive mechanisms subserve attention in macaque areas V2 and V4. Journal of Neuroscience, 19(5), 1736–1753. DOI: 10.1523/JNEUROSCI.19-05-01736.1999.
- Corbetta, M., & Shulman, G. L. (2002). Control of goal-directed and stimulus-driven attention in the brain. Nature Reviews Neuroscience, 3, 201–215. DOI: 10.1038/nrn755.
- Itti, L., Koch, C., & Niebur, E. (1998). A model of saliency-based visual attention for rapid scene analysis. IEEE Transactions on Pattern Analysis and Machine Intelligence, 20(11), 1254–1259. DOI: 10.1109/34.730558.
- Wolfe, J. M., & Horowitz, T. S. (2017). Five factors that guide attention in visual search. Nature Human Behaviour, 1, 0058. DOI: 10.1038/s41562-017-0058.
- Pieters, R., & Wedel, M. (2004). Attention capture and transfer in advertising: brand, pictorial, and text-size effects. Journal of Marketing, 68(2), 36–50. DOI: 10.1509/jmkg.68.2.36.27794.
- Rosenholtz, R., Li, Y., & Nakano, L. (2007). Measuring visual clutter. Journal of Vision, 7(2), 17, 1–22. DOI: 10.1167/7.2.17.
- Janiszewski, C. (1998). The influence of display characteristics on visual exploratory search behavior. Journal of Consumer Research, 25(3), 290–301. DOI: 10.1086/209540.