How to measure advertising effectiveness: metrics, methods and a practical framework
To measure advertising effectiveness, begin with the change the campaign is meant to cause. Then measure four connected layers: whether the advertising reached the intended audience, whether the creative was noticed and understood, whether audience memory or behavior changed, and whether the campaign produced incremental business value. No single metric can answer all four questions.
An advertisement can earn millions of impressions and communicate nothing. It can generate clicks from people who would have bought anyway. It can improve brand recall without producing an immediate sale, or deliver short-term conversions while weakening the brand cues that support future demand.
This is why advertising effectiveness cannot be reduced to click-through rate, attention, recall, return on ad spend or any other isolated number. Each metric describes one part of the system. Useful measurement connects the parts and makes clear which conclusion the evidence can support.
This guide presents a practical framework for doing that. It separates media delivery from creative quality, audience response and business effect; matches common questions to suitable methods; and shows how pre-launch analysis and in-market results can improve the next piece of work.

Advertising effectiveness is a chain of evidence. The campaign must be delivered, communicate, influence a relevant response and create value under real market conditions.
What is advertising effectiveness?
Advertising effectiveness is the extent to which advertising produces its intended change for a defined audience, over a defined period and under known conditions. The intended change may be noticing a new product, linking a benefit to a brand, considering a service, visiting a store or making an incremental purchase.
The definition has three consequences.
- Effectiveness is objective-specific. A campaign designed to introduce an unfamiliar brand should not be judged only by immediate sales. A limited-time offer should not be excused by vague improvements in sentiment if it fails to produce the intended action.
- Effectiveness is comparative. A result needs a reference: a baseline, control group, prior period, alternative creative or relevant benchmark. A number in isolation rarely tells you whether the campaign caused a useful change.
- Effectiveness depends on conditions. Audience, placement, timing, competitive activity, price, availability and the destination experience can all affect results. Record them before turning one campaign into a universal rule.
The IAB Europe Digital Advertising Effectiveness Measurement Framework separates media effectiveness, brand effectiveness and sales effectiveness. That distinction is valuable because delivery, changes in memory and perception, and commercial behavior are related without being interchangeable.
A practical measurement system should go one step earlier and examine the creative itself. If an advertisement was served but its headline could not be read, its offer was misunderstood or its memorable image was not linked to the brand, the breakdown happened before the final business metric.
The four layers of advertising effectiveness
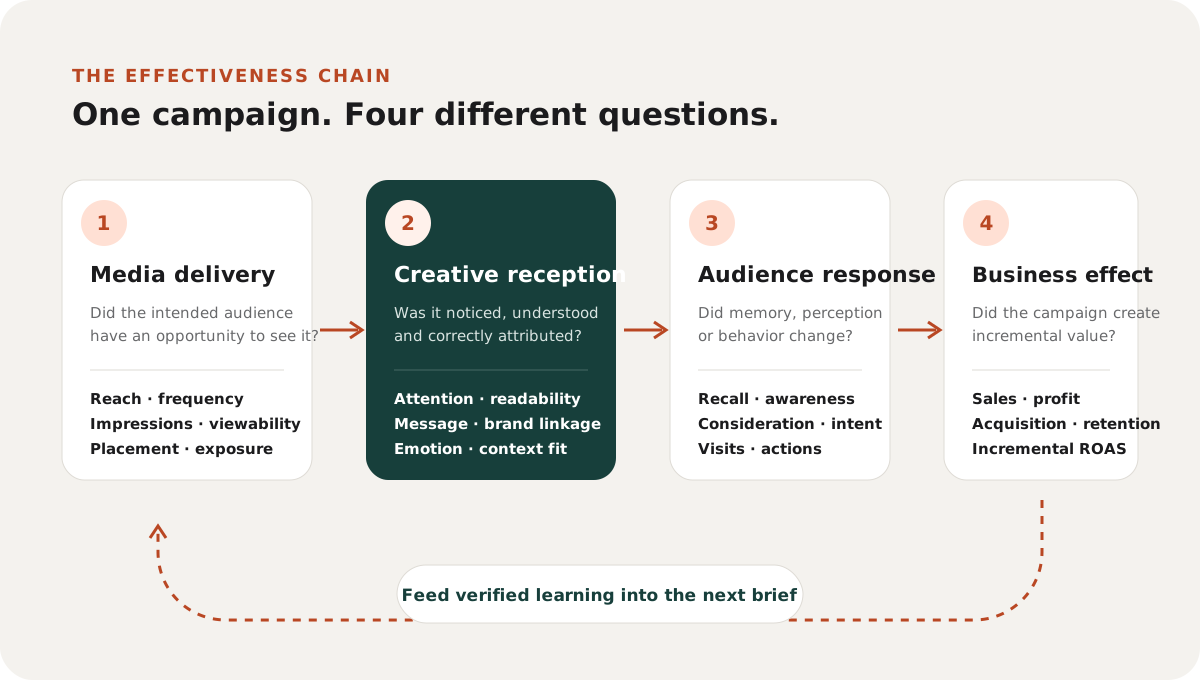
Move through the layers in order. A weakness upstream can explain a disappointing result downstream.
1. Media delivery: did the audience have an opportunity to see it?
Media delivery describes where, when and how often advertising appeared. Typical measures include impressions, reach, frequency, viewability, completed views, share of screen, geographic coverage and exposure duration.
These metrics matter because a campaign cannot work without an opportunity to be seen. They do not establish that a person paid attention, recognized the brand or changed behavior. A viewable digital impression is a delivery condition, not evidence of comprehension.
For out-of-home advertising, the measurement problem includes the display, audience movement, visibility, dwell time and likelihood of seeing the placement. The IAB Digital Out-of-Home Measurement Guide describes impression, audience, delivery and attribution considerations for DOOH. Its breadth is a reminder that a screen count or play log is only part of the exposure question.
Useful diagnostic question: Was weak performance caused by the advertising itself, or did too few suitable people have a realistic opportunity to encounter it?
2. Creative reception: did the advertising communicate?
Creative reception concerns what happens when the execution meets the placement. Does something relevant earn attention? Can essential copy be read? Is the message understood quickly enough? Can the viewer identify the advertiser? Does the emotional tone support the objective?
This layer includes attention, hierarchy, readability, cognitive load, message clarity, emotion, brand attribution, color, composition, persuasion and context fit. Optiks.ai uses these 11 domains to structure a creative effectiveness analysis.
Creative diagnostics do not replace audience or sales measurement. They help explain why an execution may struggle and identify changes worth testing. For example, low offer clarity is a more actionable finding than “the campaign underperformed,” but it remains a hypothesis until the revision is compared under suitable conditions.
Attention also needs careful interpretation. The current IAB and MRC Attention Measurement Guidelines distinguish attention to media placement from attention to the creative and recommend accounting for format, environment, device and other relevant dimensions when benchmarking. Attention creates an opportunity for communication; it does not guarantee understanding or persuasion.
Useful diagnostic question: If the intended audience encountered this execution in context, what could prevent the message and brand from being encoded correctly?
3. Audience response: did memory, perception or behavior change?
Audience response measures what people think, feel, remember or do after exposure. Depending on the objective, this can include:
- Unaided or aided advertising recall
- Brand recognition and correct attribution
- Message association
- Awareness, familiarity or favorability
- Consideration and purchase intent
- Search, site visits, store visits, inquiries or trial
These outcomes should be defined precisely. “Awareness” might mean unaided recall of the brand, recognition from a list or familiarity with a product. Those measures are not substitutes for one another.
Google Ads, for example, documents distinct Brand Lift measures for ad recall, awareness, consideration, favorability and purchase intent. It also distinguishes absolute lift from relative lift and reports cost per lifted user. The Google Ads Brand Lift documentation is useful because it makes the measured change explicit rather than treating “brand lift” as one generic score.
Useful diagnostic question: Which audience response needed to move for the campaign to accomplish its assigned job?
4. Business effect: did advertising create incremental value?
Business outcomes can include qualified leads, subscriptions, store visits, incremental sales, profit, retention or customer lifetime value. Efficiency measures relate those outcomes to investment: cost per acquisition, cost per incremental sale, profit return or incremental return on advertising spend.
The word incremental matters. Revenue observed after someone clicked an ad is not automatically revenue caused by the ad. Some customers would have purchased without that exposure. A credible incrementality design estimates the difference between what happened and what would probably have happened without the campaign.
This counterfactual cannot be observed directly for the same person at the same time. Researchers approximate it with randomized holdouts, matched markets, geo experiments or appropriately specified causal models. Google researchers describe geo experiments as assigning geographic regions to treatment and control conditions to estimate advertising effects. Read “Measuring Ad Effectiveness Using Geo Experiments.”
Useful diagnostic question: What additional value did the campaign create beyond demand that would have occurred anyway?
Choose advertising metrics from the objective
Start with the decision the campaign is meant to influence, then choose one primary outcome and a small set of diagnostic measures. A dashboard with thirty metrics can make accountability less clear rather than more complete.
| Campaign objective | Primary outcome | Supporting diagnostics | Commonly misleading substitute |
|---|---|---|---|
| Build awareness | Lift in relevant awareness or recall | Reach, frequency, attention, correct brand attribution | Impressions alone |
| Establish a message | Lift in correct message association | Comprehension, readability, brand linkage | Likes or positive comments |
| Increase consideration | Lift in consideration among the target audience | Credibility, relevance, favorability, site engagement | Click-through rate alone |
| Drive trial or purchase | Incremental conversions or sales | Qualified visits, offer comprehension, conversion rate | Attributed revenue without a baseline |
| Increase store traffic | Incremental visits in the relevant period | Local reach, search lift, direction or offer clarity | Total visits during the campaign |
| Improve efficiency | Incremental profit per advertising dollar | Media cost, conversion quality, margin, audience mix | Lowest cost per click |
Separate a KPI from a diagnostic
A key performance indicator determines whether the campaign achieved its objective. A diagnostic helps explain the result. If the objective is qualified lead generation, leads may be the KPI; attention, message clarity, click-through rate and landing-page completion may be diagnostics.
A diagnostic can improve while the business outcome declines. A more dramatic image may increase attention while reducing brand attribution. A curiosity-driven headline may increase clicks while attracting unsuitable visitors. Measure the response you actually want, then use diagnostics to understand the path.
Write the measurement sentence before launch
A useful measurement sentence has five parts:
Among [audience], this campaign is intended to change [outcome] from [baseline] over [period], compared with [reference condition].
For example: “Among occasional category buyers in Lisbon, this four-week campaign is intended to increase correct association of Northstar with same-day grocery delivery, compared with a matched unexposed group.”
This sentence exposes vague briefs. It forces the team to name the audience, outcome, timeframe and comparison before results introduce pressure to redefine success.
Advertising effectiveness measurement methods
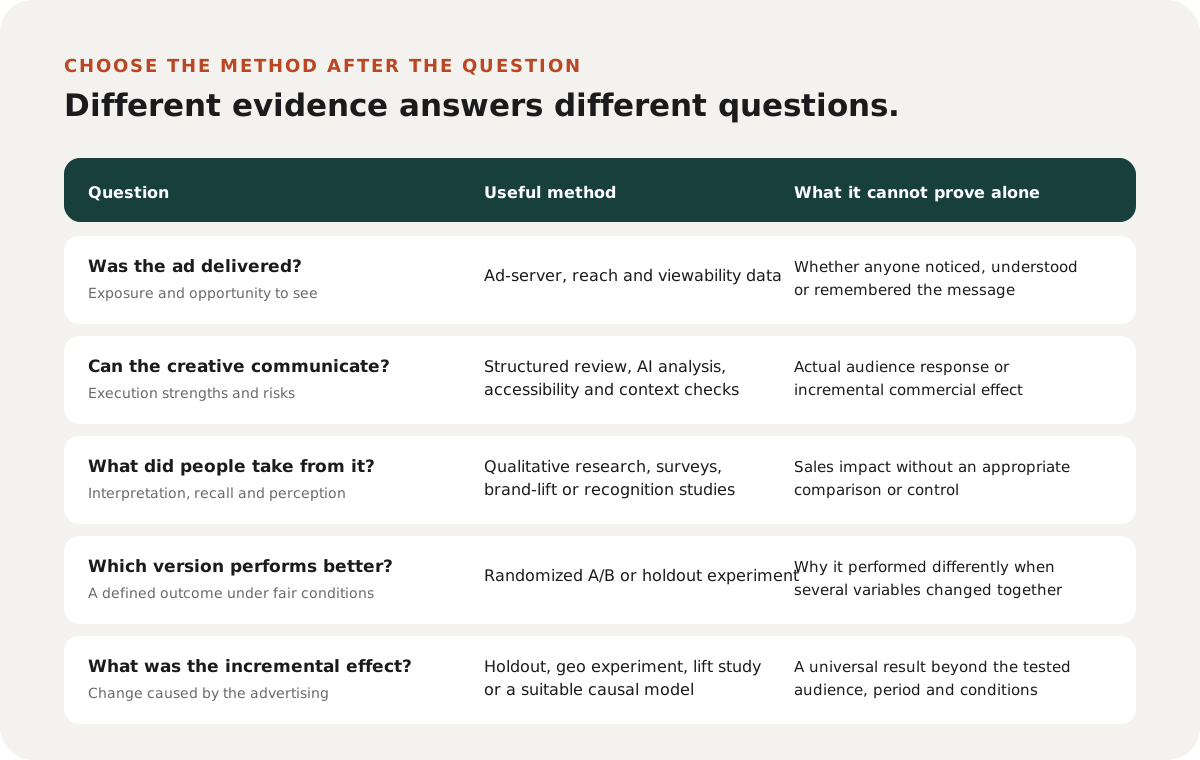
Choose methods because they answer the decision, not because they produce the most impressive dashboard.
Platform and delivery analytics
Ad servers, platforms and media owners report delivery and interaction data such as impressions, reach, frequency, viewability, completed views, clicks and engagements. These are fast and scalable, but definitions can differ across channels and platforms.
Use platform data to check delivery, diagnose large changes and define the population that had an opportunity to respond. Avoid treating a platform-attributed conversion as an independently established incremental sale without examining the attribution rules and comparison condition.
Creative analysis and expert review
Structured review, accessibility checks and AI-assisted analysis can identify execution risks before launch. They are particularly useful for checking multiple sizes, placements, versions and brand requirements while revisions remain inexpensive.
A strong review describes observable evidence: the brand appears late, the qualifier is unreadable at placement size, the visual hierarchy gives the discount more prominence than its condition, or the call to action does not explain the destination. It then proposes a change that can be evaluated.
Our guide to evaluating advertising creative before launch provides a detailed 11-domain checklist. For a comparison of evidence types, see AI creative analysis versus consumer testing.
Qualitative audience research
Interviews, observation and moderated or unmoderated tasks reveal how people interpret a message, what they find unclear and which assumptions the team missed. Qualitative findings can identify important patterns without estimating how common those patterns are in the wider population.
Avoid explaining the ad before asking what participants understood. The audience outside the study will not receive the creative director’s presentation.
Surveys and brand-lift studies
Surveys can measure awareness, recall, message association, favorability, consideration and intent. Their usefulness depends on sampling, exposure definition, questionnaire design, timing and a suitable comparison group.
Ask one question at a time, use neutral wording and distinguish recognition from unaided recall. When a reported difference is small, show sample size and uncertainty rather than presenting every movement as meaningful.
Randomized A/B tests and holdouts
A randomized experiment assigns comparable units to different conditions. It can compare two creative versions or estimate campaign lift by withholding advertising from a control group. Randomization helps balance other influences, provided implementation, sample size and outcome measurement are sound.
Change one important variable when you need to learn about that variable. If the image, offer, headline and audience all change, the test compares two packages. It cannot identify which component produced the difference.
Geo experiments
When user-level randomization is impractical, matched geographic areas can be assigned different media conditions. This is useful for channels such as television, radio and out-of-home, but regions can differ and external events can contaminate the comparison. Plan markets, duration and analysis before launch.
Marketing mix modeling and attribution
Marketing mix modeling uses aggregated historical data to estimate how marketing and external factors relate to outcomes. It can help with budget allocation across channels, especially when direct tracking is incomplete. Results depend on data quality, model assumptions, variation in spend and the variables included.
Multi-touch attribution assigns credit across observed customer touchpoints. It can describe tracked journeys but may miss unobserved exposures and offline influences. Neither method should be treated as an automatic source of causal truth.
How to build a practical advertising measurement plan
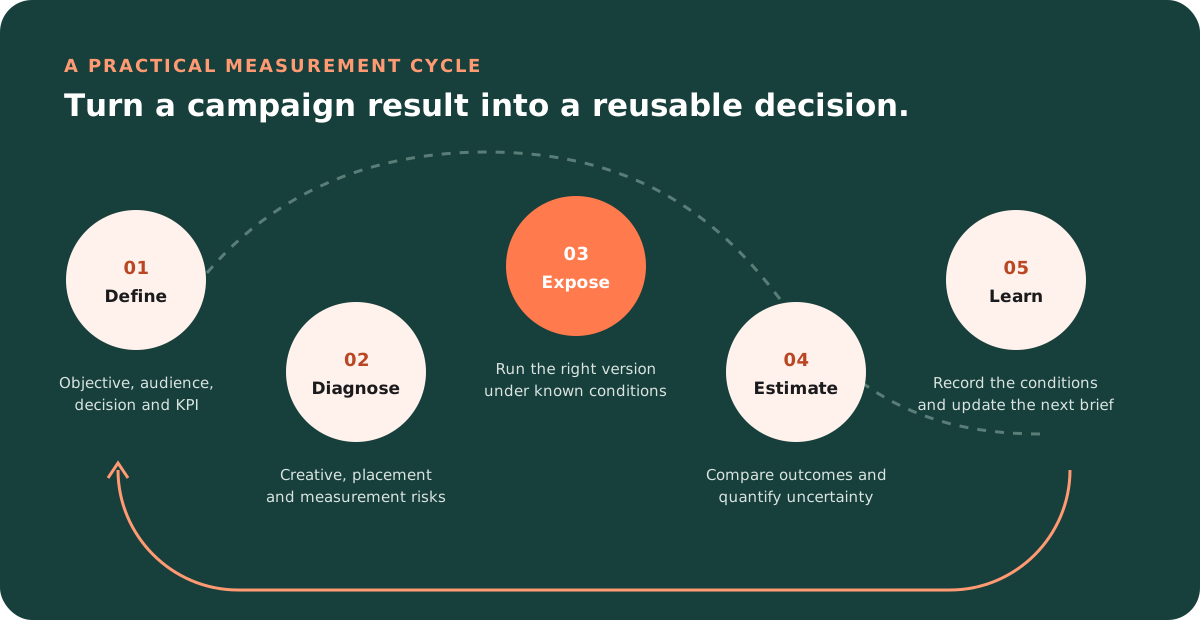
A useful measurement system ends with a better decision, not a larger archive of campaign reports.
Step 1: Define the objective and decision
Specify what should change and what decision the result will inform. Are you choosing between concepts, deciding whether to increase media, judging an offer or building evidence for the next annual plan?
Separate the commercial objective from the communication task. “Increase subscriptions” is a business objective. The creative may need to explain the subscription, overcome a concern about commitment or make the introductory value visible. Measurement should cover both levels.
Step 2: Map the path from exposure to outcome
Write the assumptions that connect the advertisement to the outcome:
- The intended audience encounters the placement.
- The creative earns enough attention to communicate.
- The viewer understands the promise and advertiser.
- The message changes a relevant memory, perception or action.
- That response contributes to an incremental business outcome.
This map tells you where to place diagnostics. If store visits do not increase, delivery, creative clarity, audience relevance, offer strength, location convenience or measurement quality could be involved. A single total cannot distinguish them.
Step 3: Select the primary KPI and comparison
Choose the measure closest to the objective that can be collected reliably. Define the baseline or control, attribution period, inclusion rules and any thresholds before seeing the data.
Do not select a benchmark simply because it is available. Benchmarks should match channel, format, objective, category and relevant viewing conditions. The Optiks.ai creative benchmarking approach compares creative profiles within defined contexts rather than assuming that one average applies to every advertisement.
Step 4: Diagnose the creative before spending
Confirm that the supplied files, landing destination and placements can perform the communication task. Review actual sizes and environments. Check required brand and legal elements. Test whether a person unfamiliar with the work can identify the advertiser, offer and next step.
Pre-launch analysis is not a claim that sales will increase. It is risk reduction: finding avoidable communication failures before media spend makes them expensive.
Step 5: Protect the test
Document campaign dates, version IDs, audience rules, budgets, placements, prices, availability and major external events. Confirm that tracking works before launch. If running an experiment, avoid reallocating budgets or changing eligibility midway unless the design accounts for it.
Step 6: Analyze magnitude and uncertainty
Report the size of the effect, not only whether a statistical threshold was crossed. Show absolute and relative change where useful. A rise from 2% to 3% is a one-percentage-point absolute increase and a 50% relative increase; both descriptions are true but create different impressions.
Check whether the effect appears across relevant segments, but avoid searching dozens of subgroups until one looks positive. Unexpected patterns are hypotheses for future testing unless the analysis was planned and adequately powered.
Step 7: Record what should change
A campaign report should end with a decision:
- What did the evidence show?
- What remains uncertain?
- Which creative or media change follows?
- What will be tested next?
- Under which conditions should this learning be reused?
Save the exact creative that ran. Without the asset, a later result such as “version B won” has little learning value.
Worked example: measuring a local delivery campaign
Imagine Northstar, a fictional grocery-delivery service, launching in Lisbon. The campaign combines digital out-of-home posters near transit stops with mobile display advertising. Its commercial objective is first orders. Its communication task is to establish same-day delivery and make the introductory offer easy to understand.
The measurement sentence
Among adults within the service area who have not ordered before, the four-week campaign is intended to increase incremental first orders compared with matched areas receiving the existing media plan.
Layer 1: delivery
The team records DOOH plays, estimated target reach, display viewability, frequency and geographic coverage. It confirms that mobile ads and posters use the correct final artwork.
A delivery shortfall would limit conclusions about the creative. If half the planned locations failed to run, disappointing orders would not prove the message was ineffective.
Layer 2: creative reception
A pre-launch review finds that the headline is readable, but the introductory offer dominates while the same-day service promise is visually secondary. Brand attribution is adequate on mobile and weaker on the outdoor adaptation.
The team produces a revision that strengthens the service promise and brand cue without adding copy. A brief unprompted comprehension check confirms that people can describe the service and condition of the offer. This reduces risk; it does not predict a guaranteed sales lift.
Layer 3: audience response
The study measures correct message association, branded search and qualified service-area visits. These show whether the communication is registering before the final order outcome. If visits increase but orders do not, price, availability or checkout may be responsible.
Layer 4: business effect
Matched areas are used to estimate incremental first orders, with campaign dates and major local promotions recorded. The team calculates contribution margin from incremental orders, rather than using gross revenue alone.
The result is interpreted as evidence for this audience, offer, market and period. The strongest reusable learning may be that branded service clarity improved response in fast-viewing placements—not that one headline will work everywhere.
Common advertising measurement mistakes
Calling correlation causation
Sales and advertising can rise together because budgets increase during periods of expected demand. A tracked conversion can also reflect existing intent. Use a suitable comparison before claiming incremental effect.
Using delivery as evidence of impact
Impressions, reach and viewability show opportunity. They do not show correct brand recall, persuasion or sales effect. Treat them as the first layer.
Optimizing the easiest metric
Clicks are convenient, but a brand campaign can work without a click and a click-heavy execution can attract low-value traffic. Select the outcome from the objective rather than the platform dashboard.
Changing the definition of success after launch
If sales do not move, it is tempting to highlight engagement; if engagement is weak, the team may point to reach. Define the hierarchy of outcomes before results arrive.
Ignoring the creative
Media analysis can show where performance changed without revealing what the audience saw. Store creative versions alongside media and outcome data. Review message clarity, brand attribution, persuasion and context fit when interpreting the result.
Treating every benchmark as universal
Benchmarks shift with category, objective, format, placement and audience. A high-performing retail offer and a financial-services awareness ad can have very different profiles. Document the comparison set and sample size.
Reporting precision the design cannot support
A dashboard can display decimal places even when the sample, exposure data or model is uncertain. Match the confidence of the language to the strength of the evidence.
Where Optiks.ai fits in the measurement system
Optiks.ai focuses on the creative-reception layer and the learning loop around it. It analyzes advertising across attention, hierarchy, readability, cognitive load, message, emotion, brand, color, composition, persuasion and context fit. The report turns those observations into prioritized action steps and alternative versions.
That helps teams answer: what in this execution could prevent the campaign from communicating, and what should we change before or during the campaign?
Optiks.ai does not turn a pre-launch score into proof of incremental sales. Instead, In-Market Results lets teams connect a saved creative and its diagnosis with observed campaign outcomes. Over time, the useful asset is not a generic claim that “high scores always win.” It is a structured record of which creative characteristics, in which contexts, relate to the outcomes that matter for a particular organization.
This preserves the role of each form of evidence:
- Creative analysis identifies communication risks and testable improvements.
- Consumer research measures audience interpretation, memory or attitudes.
- Media data records delivery and opportunity to see.
- Experiments and outcome analysis estimate behavioral and business effects.
Used together, those layers make advertising measurement more useful to the people creating the next campaign—not only the people reporting the last one.
Frequently asked questions
What is the most important advertising effectiveness metric?
There is no universal metric. The primary measure should represent the campaign’s assigned objective. Incremental first orders may be appropriate for an acquisition campaign; correct message association may be more appropriate for an unfamiliar proposition. Reach, attention and clicks can support the diagnosis without replacing the primary outcome.
Is ROAS a measure of advertising effectiveness?
ROAS compares attributed revenue with advertising cost. It is useful as an efficiency ratio, but it does not automatically measure incrementality or profit. Incremental ROAS uses the additional revenue caused by advertising, and a profit measure should account for margin and other relevant costs.
What is the difference between efficiency and effectiveness?
Effectiveness concerns whether advertising achieved its intended result. Efficiency concerns the resources used to produce that result. A campaign can be effective but expensive, or inexpensive but ineffective. Evaluate both.
Can advertising effectiveness be measured before launch?
You can evaluate whether creative is likely to communicate, compare concepts and identify execution risks before launch. You cannot observe actual campaign exposure or business outcomes before they occur. Pre-launch and in-market measurement should be connected, not confused.
How long should an advertising effectiveness study run?
The duration depends on the expected response, media schedule, purchase cycle, sample requirements and background variation. Establish the analysis period before launch and allow enough time for the relevant outcome to occur. Immediate response and longer-term brand effects may need different windows.
How should small businesses measure advertising effectiveness?
Begin with one objective, one primary outcome and a simple comparison. Preserve the creative, use consistent tracking, compare suitable time periods or locations, and record other major changes. Smaller organizations may not need a complex model, but they still need a clear baseline and honest limits.
Research and references
- IAB Europe: Digital Advertising Effectiveness Measurement Framework
- IAB: Digital Out-of-Home Measurement Guide
- IAB and Media Rating Council: Attention Measurement Guidelines, version 1.0
- Google Ads Help: Brand Lift measurement statuses and metrics
- Google Research: Methods for Measuring Brand Lift of Online Ads
- Google Research: Measuring Ad Effectiveness Using Geo Experiments
- Media Rating Council: Out-of-Home Measurement Standards
- W3C: Understanding Success Criterion 1.4.3, Contrast (Minimum)
Measurement methods should be selected and interpreted by people with appropriate research, analytics and domain expertise. Illustrative examples in this article are not reported campaign results.
Before the next campaign launches, write the measurement sentence, map the four layers and decide what evidence will change the decision. Then assess the creative while there is still time to improve it.